For those who know me a bit more, they’re likely aware of my passion for collecting and analyzing data on various topics—it’s like a hobby that satisfies my inner stats enthusiast.
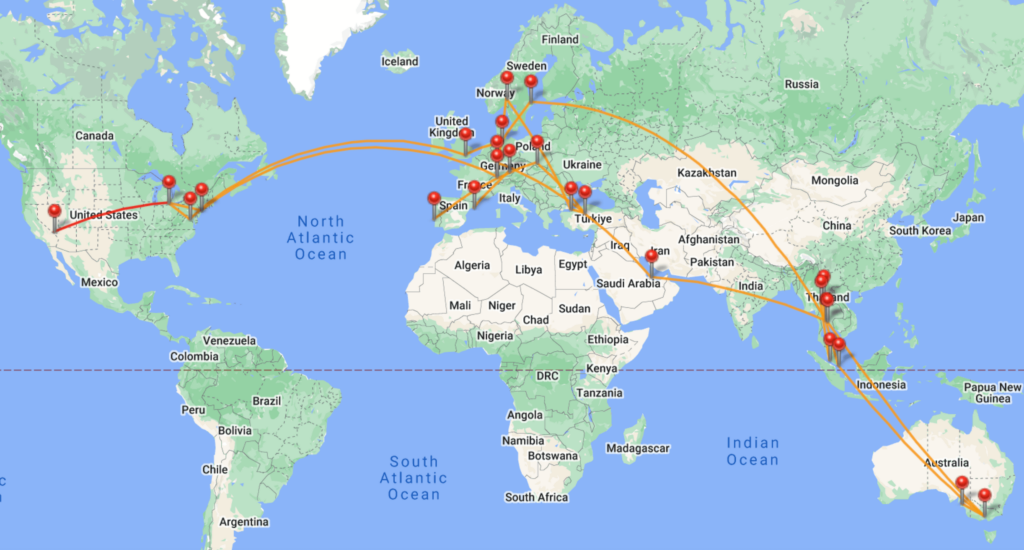
Between July 2023 and August 2024, I set off on what turned out to be my most extensive travel journey, covering four continents and visiting 17 countries. During this adventure, I gathered a ton of data and, upon my return, was able to collect even more, thanks to the digital traces we all leave behind (I’ll dive deeper into this soon).
I’ll be sharing insights from different areas, with a spotlight on financial data, which I hope many find intriguing.
Travel overview
My entire travel saga unfolds over three distinct trips, with a total of two months’ break at home in between. It’s worth noting that I didn’t collect any data during these home intervals to maintain the integrity of my analysis. To lay out the groundwork for detailed financial insights and other calculations, let’s start by tallying the travel days. My journey kicked off with a 55-day road trip across the USA in early July 2022. By October 1 of that year, I was heading to Australia for a 159-day adventure. Following that, I explored South East Asia for 37 days before heading back home for a month to recharge. My final leg was a 54-day exploration of Europe from June 2 to July 26. Altogether, I was on the move for 305 days. During these adventures, I was joined by a rotating cast of friends, leading to a cumulative 846 days of travel in my company—a figure that will later help me break down group expenses.
Travel methods
Plane
Over my year-plus adventure, I hopped on 24 different flights, mixing 7 shorter domestic ones with 17 longer international journeys. Altogether, I flew a whopping 66,426 kilometers and spent close to 100 hours up in the air. This globetrotting produced at least 8 tons of CO2 and half a kilogram of methane. (Pinning down the exact environmental impact was tougher than I thought, as it’s not just about the kilometers. You have to consider the plane’s fuel efficiency and even the contrails, which can worsen the greenhouse effect by trapping heat escaping from Earth.)
Out of all those flights, I managed to snag the window seat 16 times.
Car
One of the more surprising findings is regarding the distance we covered by car. When I tallied up the miles from driving across the USA (16,402 km), Australia (24,652 km), and Norway (2,578 km), the total hit a staggering 43,632 kilometers. We drove the equivalent of more than once around the Earth’s equator, which is about 40,075 kilometers or 11% leap towards the moon. But what really floored me was our average daily driving distance. To obtain this number, only the days were counted where we had access to a car. At the beginning of the Australia Trip and for most of the SEA and Europe trip, we did not have a vehicle and thus those days are not counted, leaving us with 134 days. Dividing the total distance travelled by that number, and we end up with an average of 325 km per day. This is definitely much more than I expected, considering there were also days when we did not use the car much at all, but rather were out exploring all day. Choosing a somewhat arbitrarily average of 80 km/h this amounts to 4 hours of driving per day!
Fuel and efficiency
Now it’s going to be a bit more technical, but personally, I thought it was fascinating to analyze the fuel consumption of the different cars that we used and compare it. I didn’t record fuel prices at the time, so I have to rely on historical averages. However, comparing the expected vs. actual expense for my fuel consumption model, I’m mostly getting an accurate prediction.
But, comparing the fuel efficiency across different vehicles is a bit like comparing apples to oranges, given the variety in car models, fuel prices, and even fuel types. A workaround was to calculate the cost per 100 kilometers driven, which offers a somewhat standardized measure of comparison.
Admittedly, this method isn’t perfect—it overlooks other operational costs associated with each vehicle, which can vary widely among drivers. For now, though, I’ve set these considerations aside.
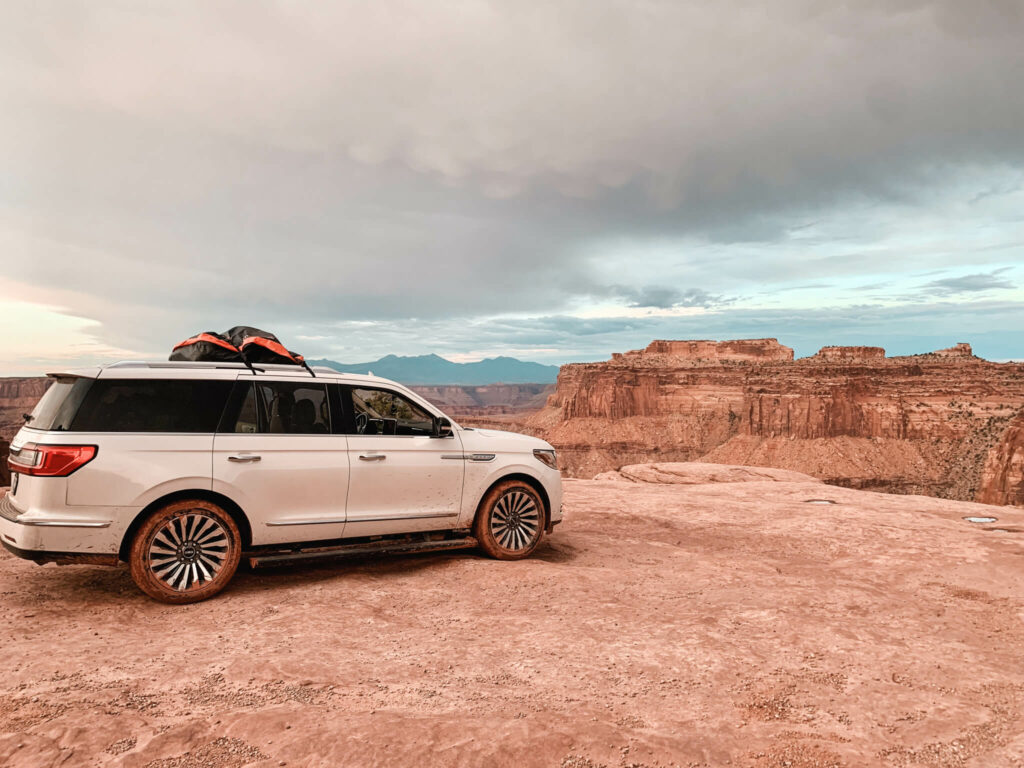
In total, we used four cars to travel considerable distances. Starting off in the US, we drove a 2020 Lincoln Navigator, 3.5L and 450 HP. This was an exorbitant gas guzzler, and we narrowly escaped financial ruin because of the lower gas prices in the US. It needs to be mentioned that we used a roof bag, sacrificing some aerodynamics and likely pushing the car’s weight just over 3 tons, otherwise I assume our mileage would have been a lot better. Nevertheless, it still shocked me, that as our trip was coming to an end we were looking at a whopping 17 l / 100 km. While such figures might not raise eyebrows in the US, over here in Europe, that level of consumption is typically the realm of large trucks or spirited Autobahn sessions.
As mentioned above, the cheap gas prices (around €1.12 per liter during July to August 2022) saved us, but we still ended up with €19 / 100 km, which being the highest of all cars used, definitely came as a surprise.
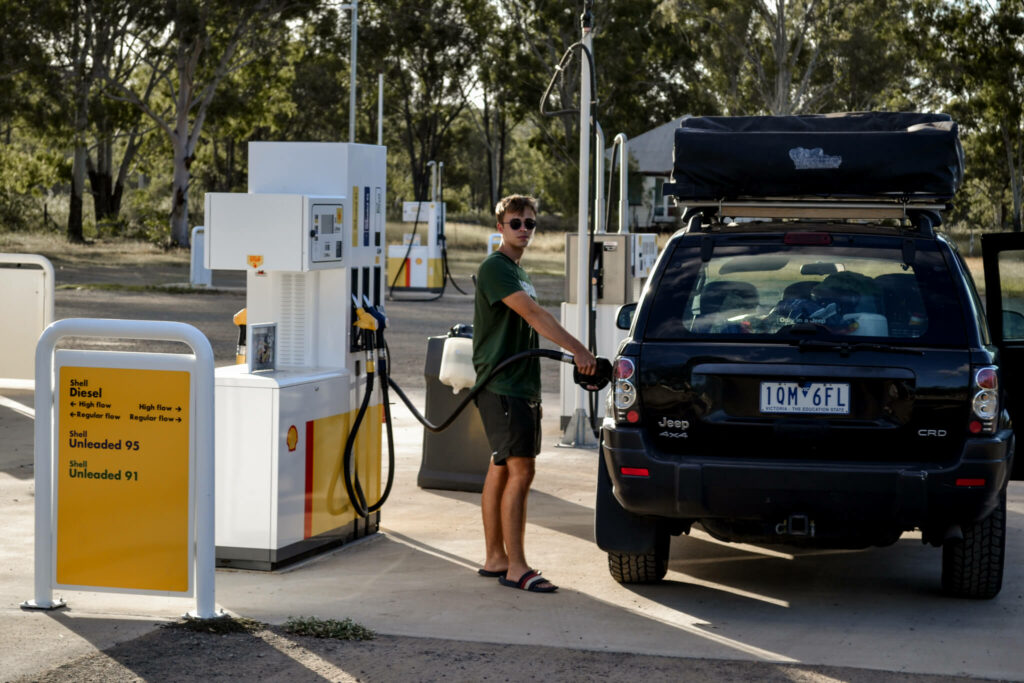
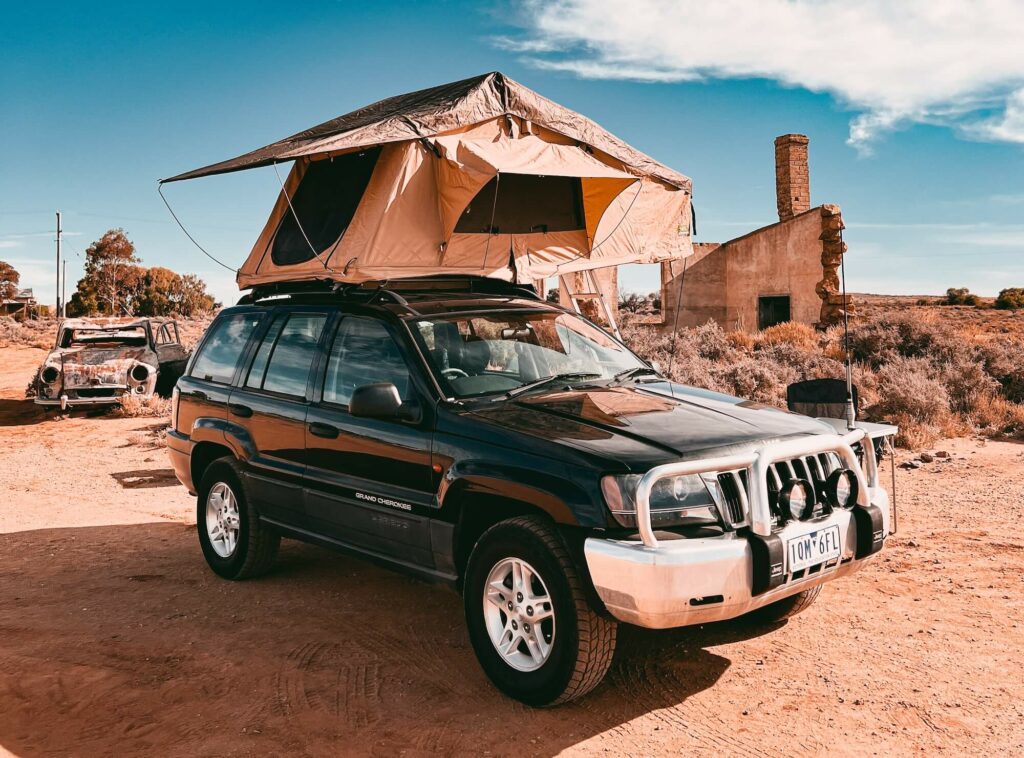
Down under in Australia, we switched gears to a 2002 Jeep Grand Cherokee. With its 163 horsepower, it struck a balance between power and fuel efficiency, averaging 8.5 liters per 100 km. Gas prices in Australia, while higher than in the U.S., were still more forgiving than Europe’s rates. An average price of €1.4 per liter translated to a cost of €12 per 100 km for us.
During a brief stint between Christmas and New Year’s, with the Jeep under the wrench for repairs, we found ourselves in a 1996 Nissan Terrano II. Despite sharing a 2.7-liter engine with the Jeep, the Nissan was thirstier, averaging 10.7 liters per 100 km and only offering 125 horsepower. This placed it second in our list of fuel expenses, costing us €15 per 100 km—proving that sometimes, older doesn’t mean more economical.
In Norway, we got behind the wheel of a 2020 Suzuki Across 4×4 Pih, which is essentially a rebadged Toyota RAV4. Suzuki tweaks it slightly and markets it under their brand, partially to sidestep emission fines.
This hybrid was a game-changer in terms of fuel efficiency from what I’ve experienced before. Unfortunately, we hit a snag since it didn’t come with a charging cable, and we couldn’t find compatible adapters for the charging stations. But being in Norway, with its towering mountains and deep fjords, the car’s battery wasn’t just a lump of useless weight. I reckon that the energy recouped from downhill driving nearly balanced out the energy spent climbing those inclines (talking distance here, not energy). This neat feature helped us achieve an impressive average fuel consumption of 5.5 liters per 100 km.
Despite Norway’s notoriously steep gas prices—actually, everything there seems to cost an arm and a leg—we managed to keep our spending to a reasonable €10.5 per 100 km. That’s pretty remarkable, especially since we pretty much lived in the car’s sport mode.
Train
In total, I drove 5016 km by train, with the bulk of that happening in Europe. I really grew to appreciate the amount of work you can get done on a train compared to a car (too much movement) and airplane (no Wi-Fi)
Bus
I clocked in 2,407 km traveling by long-distance bus. This figure doesn’t cover short hops on public transport buses, just the stretches when we really covered some ground, moving from one city or country to another.
Boot / Ferry
I took a ferry for 257 kilometers to reach and return from Koh Tao in Thailand. This was a necessary part of the journey to explore the beautiful island.
Uber and ride-share
I ended up covering 123 km through Uber rides, which cost me €250. These figures only reflect the rides I personally booked. If I factor in the Ubers my friends ordered throughout our trip, the total distance and expense likely quadruple or quintuple.
Inflation and foreign currencies
All prices presented here are not adjusted for inflation. This is partly because of the complexity involved due to the expenses occurring in different countries and inflation rates not being available in real time. Also, I want to keep the focus on the out-of-pocket prices, reflecting the true amount that was spent.
However, I did convert all expenses incurred in foreign currencies into Euros, using the closing exchange rate of the day on which each expense was made. For instance, if I spent one US Dollar on August 20, 2022, I’ve accounted for it as one Euro in my calculations, instead of €0.92, which is the exchange rate at the time of writing.
Finances
Now, the section many of you have likely been eagerly anticipating. My primary motivation for divulging all this information is to offer a clear and honest perspective to those who wish to embark on a similar journey. Understanding the financial aspect is vital for long-term planning and maximizing the duration of your adventure.
Individual spending
During the 305 days I travelled, I spent a total of €34.188,00. This amounts to €112 per day or €3,411.79 per month. This is way higher than I expected because it certainly did not feel like I was spending that much day to day. However, this number obviously also contains long-term expenses, things like health insurance, buying a car and replacing gear like when my AirPods broke down, as well as a new phone.
I believe it’s entirely possible to embark on a journey of similar duration for significantly less money. However, replicating my exact experience might be more challenging. Destinations like the USA, Australia, and Europe rank among the priciest for travelers. I was mindful of my expenditures, understanding that saving even a single euro could potentially extend my travels by another day—a trade-off I found far more valuable than luxury. My frugality extended to sleeping in airports to save on accommodation and flights, and even considering a loop around Costco for free samples as a meal during my time in the US.
Throughout my journey, the support from family, friends, and even strangers played a pivotal role, making many of these experiences possible. Despite spending more than anticipated, I harbor no regrets. The value derived from these experiences far outweighs any financial cost. By being conscientious about my spending throughout the trip, I ensured that I maximized the extent of my travels with the resources available to me.
I would love to offer a more detailed financial breakdown here, as I will for our group expenses. However, navigating through the complexities of using at least five different bank accounts, in addition to cash transactions, has made it nearly impossible to present a precise overview. The financial estimate provided is based on a thorough consideration of my income, for which I have exact figures.
Group spending
All group-related expenses were meticulously documented using an app designed to track purchases and simplify the process of settling up afterwards. As a result, I have a comprehensive record of all group expenses, along with their corresponding categories.
However, it’s important to note that this doesn’t cover individual spending that fell outside our group activities—like those times we each paid for our own lunches. But for shared expenses like fuel, car costs, or accommodation, the data is pretty solid and gives a good reflection of our collective spending.
I categorized the expenses into the following categories
- Groceries → raw food ingredients to be processed into meals
- Food → finished meals consumed in restaurants
- Miscellaneous → expenses such as laundry or random transactions
- Recreation → all expenses involving alcohol / partying
- Fuel → pretty self-explanatory
- Accommodation → motels and campground
- Sights, activities, and entertainment → entry fees, tours etc.
- Car Expenses → purchasing, renting or maintenance spendings
- Transportation → Plane tickets, Uber and buses
USA
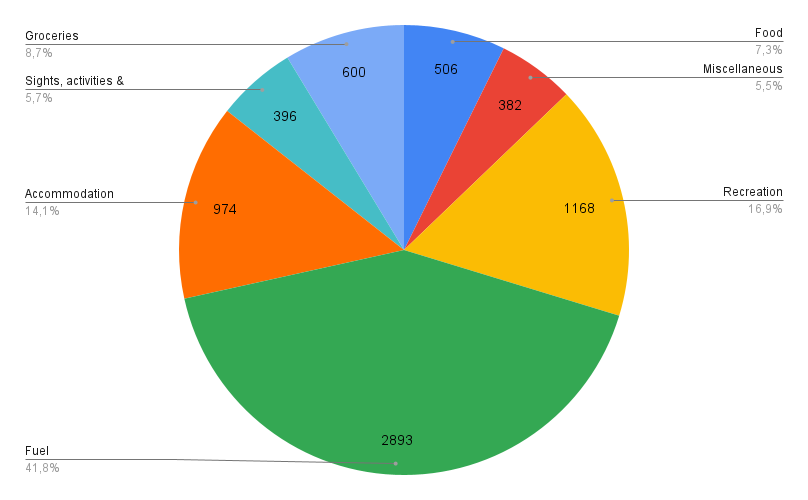
Total group spending: €6919
Average spending per day: €172
Perhaps most notably here is that almost 50% of the group expenses consist merely of fuel. Recreation comes second with a pretty large chunk as well. At the same time, we did really well on saving on accommodation, sleeping in the car or disperse camping wherever possible.
Australia
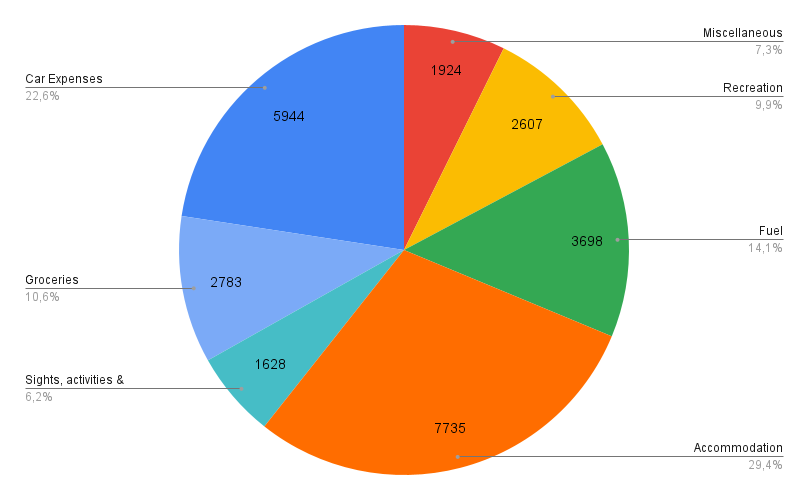
Total group spending: €26319
Average group spending per day: €166
This presents a much more balanced view with no immediate outlier. Much higher is the accommodation cost (Melbourne ain’t cheap) as well as Car Expenses. Some of that was recouped by selling the car. Again, very high recreation expenses.
Europe
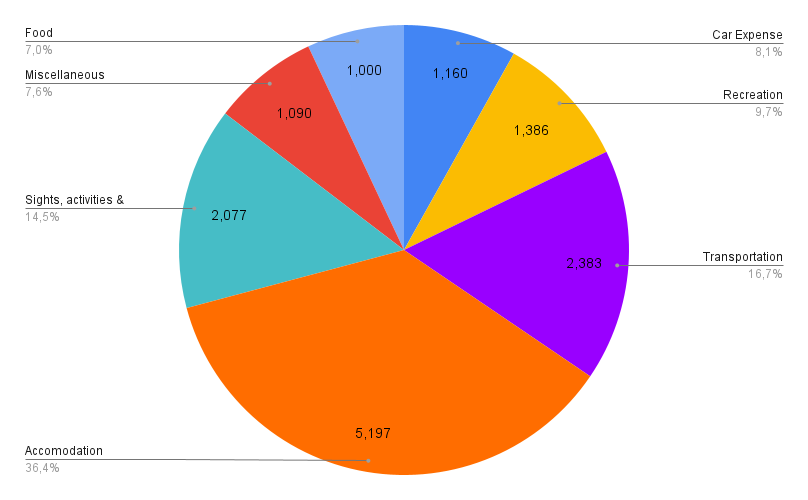
Total group spending: €14293
Average group spending per day: €264
Since the Europe trip consisted almost entirely of cities, accommodation is the main expense here. Transportation is also notably higher and includes plane tickets, Uber and buses. All of the car expenses were accrued in the last week of the trip in Norway.
Conclusion
The most significant insight from this post is likely no surprise: traveling is not inexpensive. However, a critical piece of advice I’d like to emphasize is the substantial cost savings achievable through group travel. Except for South East Asia, where traveling can be remarkably affordable even solo, I have always travelled with a group. This approach has allowed us to divide many costs, most notably for accommodation, groceries (which benefit from economies of scale), and car-related expenses. Traveling solo is an incredible journey, one I believe every traveler should experience at least once. However, embarking on these adventures with good friends usually adds more joy for most people, making it a win-win situation.
Now, I hope I’ve managed to give you a clearer picture of what traveling really looks like in terms of numbers— covering both the enjoyable insights and the crucial, serious considerations regarding costs and financing.